This scenario planner tool is a surveying software tool designed to assist property stock managers to organise and plan their forward refrubishment work commitments. Produce costing plans of up to 30 years into the future.
Scenario Planner is a tool designed to assist housing stock managers to organise and plan their forward works commitments. It is based on remaining lifetimes and life-spans of existing housing stock elements. It can help to produce costing plans of up to 30 years into the future by using visual aids to present mass data in a manageable and easy to understand way. Blocks of works can be filtered by almost any criteria and any excessive peaks of workload moved or spread across different years.
Scenario Planner works closely with the database and reporting system and combines its View system with your Schedule of Rates (SoR) to produce graphical representations of current works schedules, which can be overlaid with any changes and adjustments that you make.
No changes are made to the actual data until you commit them. Changes can be done and undone as often as you like, allowing the overall effects of different scenarios to be compared and refined.

This shows a plot of yearly costs. The magenta line is the present schedule. There are some quite obvious peaks - so the first step would be to get a breakdown of what contributes to the cost of each peak. Let's start with the backlog peak at B.
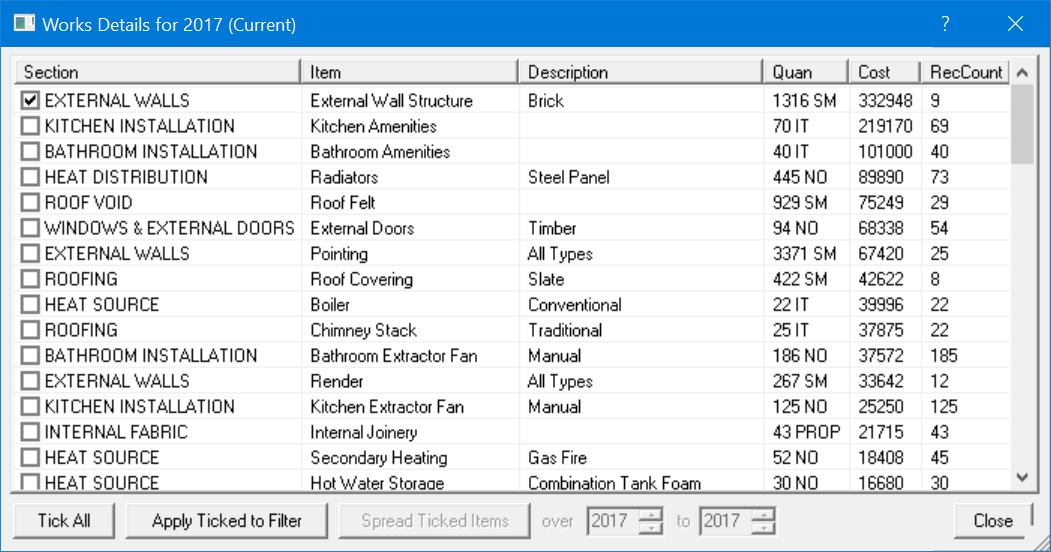
Clicking on the backlog peak produces the following breakdown of costs; the largest cost at the top.

We can see that External Walls tops the list - so tick the box and apply it to the filter

Notice that the Item is now ticked in the filter tree in the right hand panel (the tree is constructed from your SoR). The yellow line shows the annual costs for this work. We can now move the work out of Backlog and spread the work over say, the next couple of years by using the controls in the breakdown dialog to do the adjustment.


This shows the effect after several adjustments. Compare the resulting magenta line with the dark line of the original schedule.
Do YOU want to become a super-efficient surveyor, make more profit, and have more leisure time?
If so, fill in the form below to find out more about our cloud-based surveying software.
Sales: 0161 818 4683

If you're a busy overworked surveyor, you really need this software!
Try out the software at low-cost for one month while you decide if it's for you.
We won't send you spam. Unsubscribe at any time.